
Built-in Admin UI in Gruxi: Simplifying Web Server Management
Managing a web server often means jumping between configuration files, terminal commands, and separate monitoring tools. That workflow is workable, but it is rarely fast. Even small changes can turn into a multi-step process: edit configuration, reload the service, tail logs, then open another dashboard to check whether the server is actually behaving the way you expect.
Gruxi takes a different route. It ships with a built-in web server admin UI, so configuration, basic monitoring, and operational checks are available from the same place. If you are searching for a web server admin UI, a server monitoring interface, or a Gruxi web interface that does not require extra setup just to become usable, this is one of Gruxi's clearest differentiators.
Why web server management is usually more manual than it should be
With many servers, the common workflow still looks like this:
- edit raw configuration files by hand
- reload or restart the service to apply changes
- inspect logs in a terminal or on disk
- wire in Prometheus, Grafana, or other tools for visibility
That stack can make sense in larger environments, but it is also a lot of operational glue when your immediate goal is simply to validate routing, confirm a PHP handler is responding, or see whether the server is under load.
For local development, self-hosting, internal tools, and smaller deployments, that friction adds up. You spend more time managing the server around the application than working on the application itself.
Gruxi's built-in admin portal solves the basics in one place
Gruxi includes a built-in admin portal on port 8000, which in the default setup is available at https://localhost:8000. On first run, Gruxi generates the admin password and prints it to the server output once, so you can log in immediately without setting up a separate management layer first.
That matters because the admin UI is not just a thin status page. It is the control surface for day-to-day server work:
- edit and reload configuration from the browser
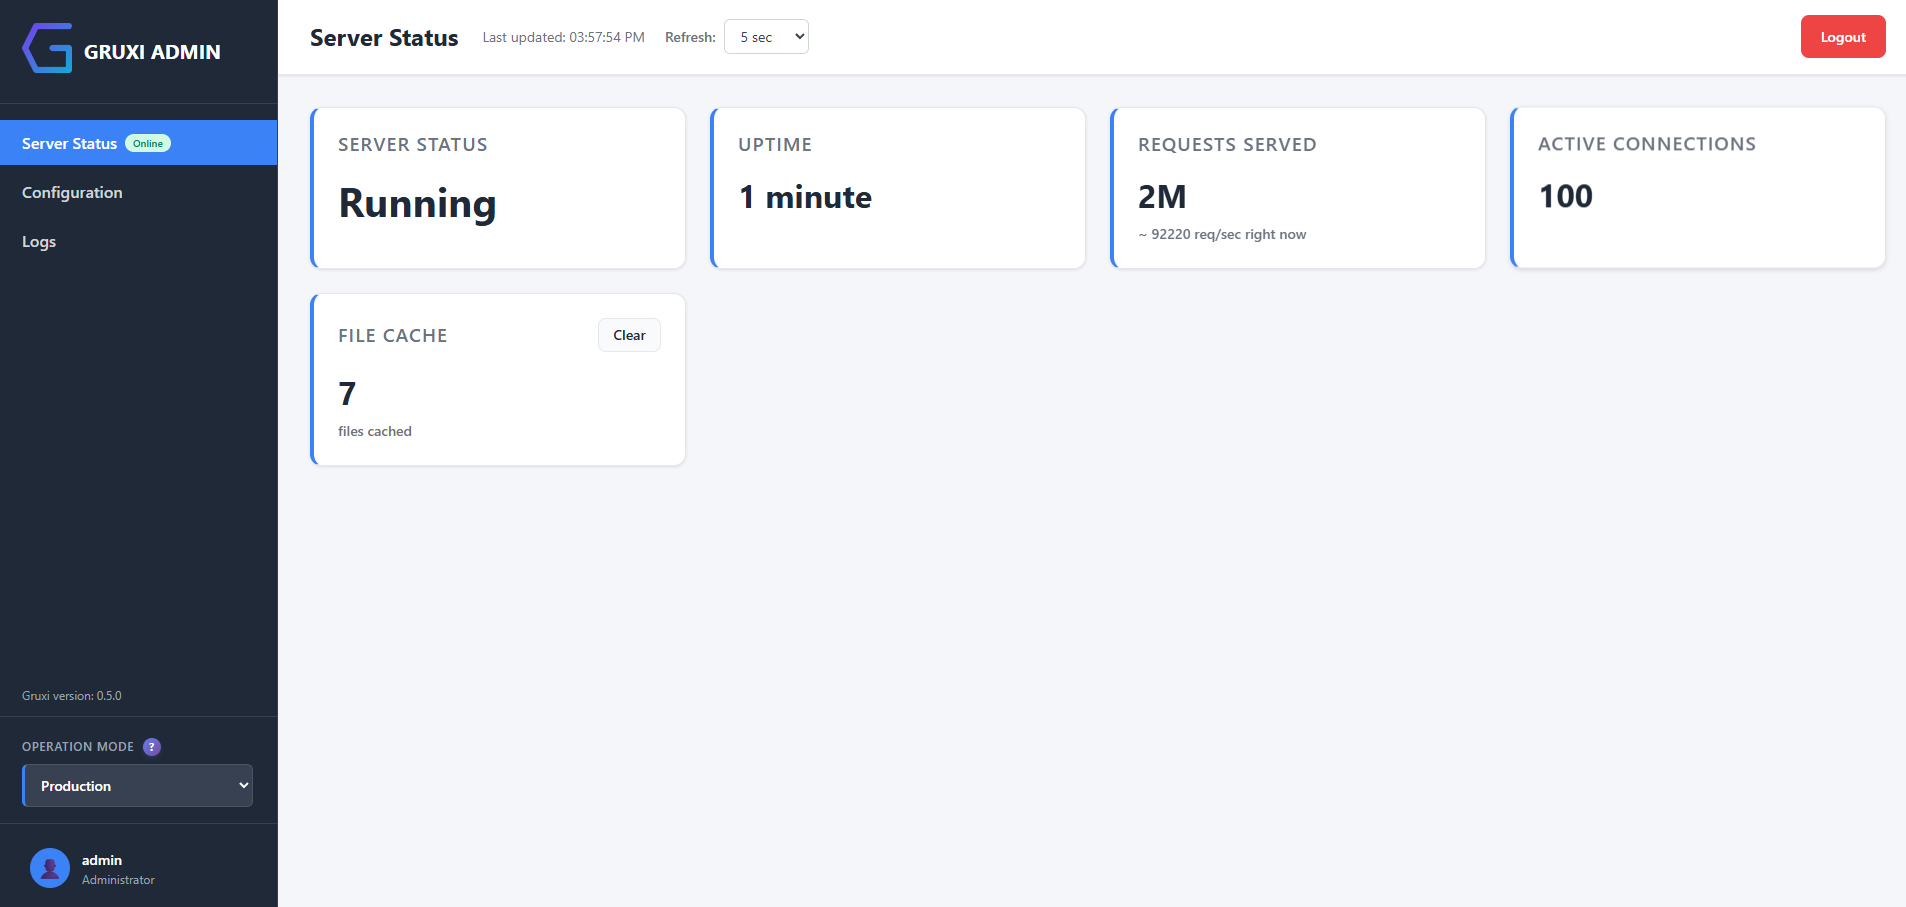
- inspect live metrics and server status
- review logs and recent activity
- manage site settings, processors, bindings, and related options
Gruxi also has built-in metrics. The admin portal presents them in a more user-friendly format, which means you can get useful operational feedback without first standing up Prometheus and Grafana. If you need formal telemetry later, Gruxi supports that too, but for basic visibility the built-in interface is often enough.
What you can do in the Gruxi web interface
The two most immediately useful parts of the interface are configuration management and monitoring.
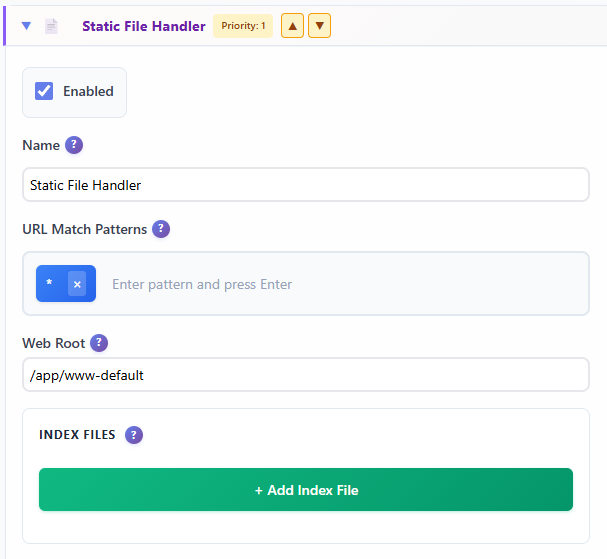
Configuration editor
Instead of maintaining a pile of server config files by hand, you can log in, edit the relevant site or processor, and reload the configuration directly from the admin portal. That is especially useful when you are:
- testing a new site definition
- adjusting PHP or proxy settings
- validating rewrite behavior
- switching between environments during development
The same interface is used for common configuration tasks across Gruxi, which keeps the workflow more consistent than stitching together several tools.
Live metrics and server status
Gruxi exposes built-in metrics for monitoring server performance and health, and those metrics are available directly in the admin portal. In practice, that gives you a live server monitoring interface for the questions you usually want answered first:
- are requests coming in right now?
- how busy is the server?
- how is the cache populated and perhaps clean it if needed?
For someone evaluating Gruxi as a practical web server, this is significant. High-performance servers often expect you to assemble the monitoring experience yourself. Gruxi gives you live metrics and server status out of the box.
Log viewer and quick diagnostics
When a route fails, a backend does not respond, or a configuration change does not do what you expected, the next step is usually log inspection. Having that available in the same admin surface shortens the debugging loop. You do not need to switch from browser to shell to another dashboard just to understand one failed request.
Demo walkthrough: from configuration to monitoring
The easiest way to understand the admin UI is to run Gruxi and open the admin portal locally.
- Start Gruxi - See getting started documentation for installation and setup instructions.
- Open the admin portal on localhost port 8000, typically
https://localhost:8000. - Sign in as
adminwith the generated password printed to the server output on first run. - Open the configuration area and inspect the default site, bindings, and processors.
- Make a small change, then use the reload action to apply it without restarting the whole server.
- Switch to the monitoring view to inspect live metrics and current server status.
- If something looks off, open the log viewer to confirm what happened.
That flow is a good representation of how the product is meant to be used. You can move from setup to verification quickly, without treating monitoring as a separate project.
For developers and operators, that leads to a few practical use cases:
- quick debugging when a site or processor is misconfigured
- validating settings immediately after a change
- checking server activity during local development or a test deployment
- making on-the-fly changes without rebuilding a management stack around the server
A simpler server management experience
Gruxi's admin UI makes server management more approachable. You still get direct control over configuration and observability, but the basics are available in one built-in interface instead of being spread across files, scripts, and external dashboards.
If you want a web server admin UI that also gives you a practical server monitoring interface, Gruxi is worth trying. Run the server, open the admin portal, and explore the Gruxi web interface yourself. From there, you can decide whether you need deeper external monitoring, but for many common workflows the built-in experience already covers the important first layer.
If you want to continue from here, start with the Getting Started docs, then review the configuration overview and the metrics documentation.